Displaying Multidrug Use
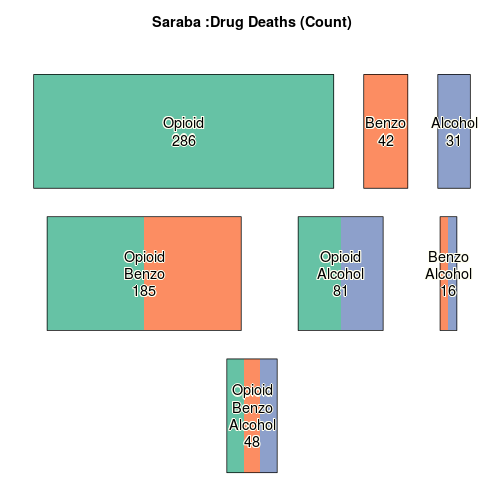
05 Nov 2015Increased use and abuse of opioid has become an alarming public health challenge. Often opioid is used in combination with other drugs, enhancing the risk of death. The association with benzodiazepine is known to be fatal. Searching into all the columns with cause of death codes, one can find the different instances of multidrug use and summarize them in a graph.
Visualizing Multidrug Deaths with plotrix
The count of the various multidrug use could be displayed with a Venn diagram. . However as the number of intersections increases, the diagram become illisible. A good alternative of Venn diagram is the function intersectDiagram from the R package plotrix .
It recreates the different compartments of the Venn diagram in separate rectangles. In addition the drugs are color coded, and the rectangle sizes are proportional to the count of death for the drug.
We modified the function intersectDiagram in order to remove the boxed labels (from the original function intersectDiagram) and add shadowed labels.
Install the package vennplus
I create a small package called vennplus that contains the functions and data needed in this exercise. Use package devtools to install and run vennplus as follow:
devtools::install_github("epinotes/vennplus")
library(vennplus)
Load the simulated matrix(venndrug) of 1,000 deaths with indication of whether opioid, alcohol or benzodiazepine were used alone or in combination. Check the first 10 cases:
data(venndrug)
head(venndrug, 10)
      Opioid Benzo Alcohol
 [1,]      0     0       0
 [2,]      1     0       0
 [3,]      1     1       1
 [4,]      1     0       0
 [5,]      0     0       0
 [6,]      1     1       0
 [7,]      1     0       0
 [8,]      0     0       0
 [9,]      1     0       0
[10,]      1     0       0
For more details on vennplus see the github project
Loading packges plotrix and RColorBrewer
Use the package plotrix for the function makeIntersectlist that will transform the data matrix venndrug into a list of the intersection sets saved into the object "drug3". The package RColorBrewer provides the colors used in the graph.
library(plotrix)
drug3 <- makeIntersectList(venndrug,sep="\n")

library(RColorBrewer)
col3 <- brewer.pal(8, "Set2")
Producing the graph
The final graph with the simulated data from the fictive place Saraba.
intersectDiagram2(drug3,main="Saraba :Drug Deaths (Count)",sep="\n",col=col3,cex = 1.2,bg="transparent", border = NA)